Data Visualization in Python | Graphs in Python | Python Graph
Data Visualization in Python basically refers to the graphical or visual representation of information and data using charts or graphs.
We can create many graphs or charts using python such as line chart,bar chart, pie chart etc..
In data visualization, we have to use Matplotlib Library's Pyplot.
Pyplot is a collection of methods within matplotlib library which allows user to construct 2D plots or charts easily and interactively.
Note: The matplotlib is a python library that provides many interfaces and functionality for 2 D- graphics. This library offers many different named collections of method. Pyplot is one such interface.
Pyplot is a collection of methods within matplotlib which allows user to construct 2D plots easily and interactively. Pyplot essentially reproduces plotting functions.The Pyplot interface provides many methods for 2D plotting of data.
The matplotlib's Pyplot interface lets one plot data in multiple ways such as line chart, bar chart, pie chart, scatter chart etc.
As we know that Graphs and Charts are very effective tools for data visualization. So we can create many different types of graphs and charts using PyPlot. Also,we can easily plot the data available in the form of NumPy arrays or dataframes etc.
Types of Charts | Graphs | Plots
- Line Chart
- Bar Chart
- Pie Chart
- Histogram Chart
- Scatter Chart
- BoxPlot Chart
Line Chart
A line chart or line graph is a type of chart which displays information as a series of data points called 'markers' connected by straight line segments. With PyPlot, a line chart is created using plot() function. Data points are called 'markers'
plot() function in line chart
Note plot() function is used to create a line chart with single statement or multiple statements. show() function is used to display the graph on the screen.plot() function takes list or array as an argument to draw a line chart.
Syntax of line graph
import matplotlib.pyplot as plt
plt.plot(<data1>,<data2>,<arguments(Optional)>)
for example
We have single statement
import matplotlib.pyplot as plt
or
from matplotlib import pyplot as plt
rollno=[1,2,3,4]
marks=[10,15,20,25]
plt.plot(rollno,marks)
plt.show()
Arguments in line chart
We can format our line graph using some arguments such as linestyle or ls , linewidth, marker, markersize, markeredgecolor, color , label etc.
linestyle : linestyle or ls argument is used to give the style of line. There are four line styles such as solid, dashed, dotted and dashdot.
By default line displays in solid form.
plt.plot(x,y,linestyle='solid')
linewidth : linewidth argument is used to give the width of line.
It takes integer value such as 2,3,1,4 etc.
plt.plot(x,y,linewidth=4,ls='dashed')
marker : marker argument is used to give a symbol or a valid marker style such as '-', 'o', 'x', '+', 'd' etc.
plt.plot(x,y,marker='d')
markersize : markersize argument is used to give the size of marker in values.
plt.plot(x,y,markersize=5,marker='+')
markeredgecolor: markeredgecolor argument is used to give a valid color for markers. If you donot specify markeredgecolor argument separately, it takes the same color as the line.
plt.plot(x,y,markeredgecolor='red')
label: label argument is used to display the label for line.But to show the label inside the graph, you will have to use legend() method. The legend() method helps to show label inside graph. If you do not use legend() method then label will not be displayed.
plt.plot(x,y,label="Amit's Marks")
plt.legend()
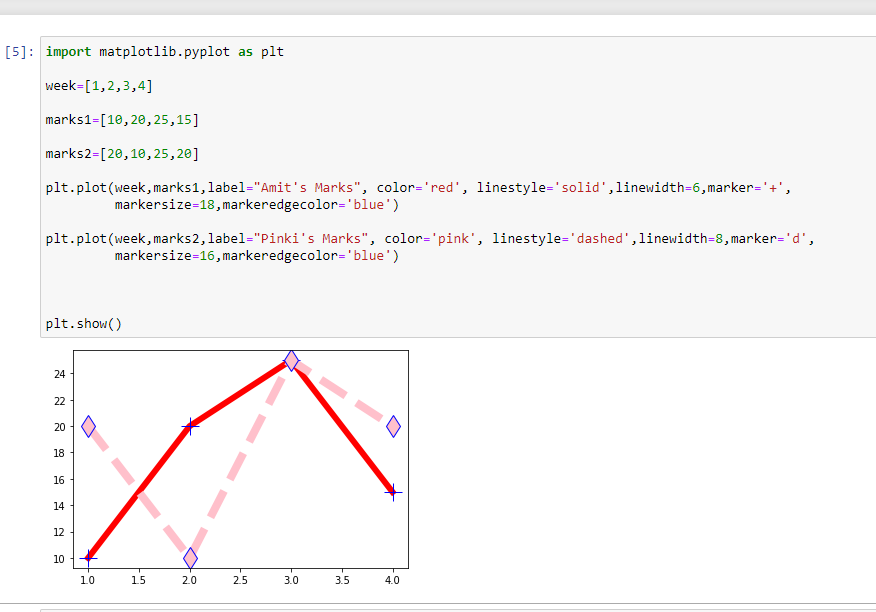
Example of Line Graph
import matplotlib.pyplot as plt
week=[1,2,3,4]
marks1=[10,20,25,15]
marks2=[20,10,25,20]
plt.plot(week,marks1,label="Amit's Marks", color='red', linestyle='solid',linewidth=6,marker='+',markersize=4,markeredgecolor='blue')
plt.plot(week,marks2,label="Pinki's Marks", color='pink', linestyle='dashed',linewidth=8,marker='d',markersize=6,markeredgecolor='blue')
plt.show()
Methods Used in Line Chart
xlabel() method
ylabel() method
title() method
grid() method
legend() method
We can use xlabel() method and ylabel() method to display text for x-axis and y-axis.And title() method to give the title to the graph.The legend() method helps to show label argument (that is given with plot() method ) inside graph.
plt.xlabel("Weeks")
plt.ylabel("Marks")
plt.title("Report Card")
you can give any text to xlabel and ylabel.


No comments:
Post a Comment